Updating search results...

Search Resources

629 Results

View
Selected filters:
  • Atmospheric Science
22 Years of Sea Surface Temperatures
Read the Fine Print
Some Rights Reserved
Rating
0.0 stars

This NOAA visualization on YouTube shows the seasonal variations in sea surface temperatures and ice cover from 1985 to 2007. The visualization is based on data collected by NOAA polar-orbiting satellites. El Niño and La niña are easily identified, as are the trends in decreasing polar sea ice.

Subject:
Agriculture and Natural Resources
Applied Science
Atmospheric Science
Earth and Space Science
Environmental Science
Environmental Studies
Physical Science
Material Type:
Activity/Lab
Provider:
CLEAN: Climate Literacy and Energy Awareness Network
Provider Set:
CLEAN: Climate Literacy and Energy Awareness Network
Date Added:
03/09/2023
6.3 Weather, Climate & Water Cycling
Unrestricted Use
CC BY
Rating
0.0 stars

The goals of OpenSciEd are to ensure any science teacher, anywhere, can access and download freely available, high quality, locally adaptable full-course materials. REMOTE LEARNING GUIDE FOR THIS UNIT NOW AVAILABLE!

This unit on weather, climate, and water cycling is broken into four separate lesson sets. In the first two lesson sets, students explain small-scale storms. In the third and fourth lesson sets, students explain mesoscale weather systems and climate-level patterns of precipitation. Each of these two parts of the unit is grounded in a different anchoring phenomenon.

Subject:
Applied Science
Atmospheric Science
Earth and Space Science
Environmental Science
Physical Science
Material Type:
Full Course
Lesson
Lesson Plan
Module
Teaching/Learning Strategy
Unit of Study
Provider:
OpenSciEd
Date Added:
04/14/2023
6.3 Weather, Climate & Water Cycling - Unit Overview
Unrestricted Use
CC BY
Rating
0.0 stars

This unit on weather, climate, and water cycling is broken into four separate lesson sets. In the first two lesson sets, students explain small-scale storms. In the third and fourth lesson sets, students explain mesoscale weather systems and climate-level patterns of precipitation. Each of these two parts of the unit is grounded in a different anchoring phenomenon.

Subject:
Atmospheric Science
Earth and Space Science
Material Type:
Unit of Study
Provider:
OpenSciEd
Date Added:
04/14/2023
6.5 Natural Hazards
Unrestricted Use
CC BY
Rating
0.0 stars

This unit begins with students experiencing, through text and video, a devastating natural event that caused major flooding in coastal towns of Japan. Through this anchoring phenomenon, students think about ways to detect tsunamis, warn people, and reduce damage from the wave. As students design solutions to solve this problem, they begin to wonder about the natural hazard itself: what causes it, where it happens, and how it causes damage.

This unit is part of the OpenSciEd core instructional materials for middle school.

Subject:
Applied Science
Atmospheric Science
Earth and Space Science
Physical Science
Material Type:
Lesson
Lesson Plan
Unit of Study
Date Added:
04/14/2023
7.5 Ecosystem Dynamics
Unrestricted Use
CC BY
Rating
0.0 stars

How does changing an ecosystem affect what lives there? This unit on ecosystem dynamics and biodiversity begins with students reading headlines that claim that the future of orangutans is in peril and that the purchasing of chocolate may be the cause. Students then examine the ingredients in popular chocolate candies and learn that one of these ingredients--palm oil--is grown on farms near the rainforest where orangutans live. This prompts students to develop initial models to explain how buying candy could impact orangutans.

This unit is part of the OpenSciEd core instructional materials for middle school.

Subject:
Agriculture and Natural Resources
Applied Science
Atmospheric Science
Earth and Space Science
Engineering
Environmental Studies
Life Science
Material Type:
Lesson
Lesson Plan
Unit of Study
Date Added:
04/14/2023
ADAPTATION: Floating Gardens of Bangladesh
Read the Fine Print
Educational Use
Rating
0.0 stars

This video begins in the lush deltas of Bangladesh. The host of the video learns how communities are adapting to changing monsoons and dangerous sea-level rise. Floating gardens and floating schools are just the start of some of the country's innovative strategies.

Subject:
Agriculture and Natural Resources
Applied Science
Atmospheric Science
Earth and Space Science
Environmental Science
Environmental Studies
Oceanography
Physical Science
Material Type:
Diagram/Illustration
Reading
Provider:
CLEAN: Climate Literacy and Energy Awareness Network
Provider Set:
CLEAN: Climate Literacy and Energy Awareness Network
Author:
LearningMedia
Public Broadcasting Service
Date Added:
08/01/2022
Absorption by atmospheric gases of incoming and outgoing radiation
Read the Fine Print
Educational Use
Rating
0.0 stars

In this activity, students use the absorption spectra of greenhouse gases to explore the nature of the greenhouse effect.

Subject:
Agriculture and Natural Resources
Applied Science
Atmospheric Science
Earth and Space Science
Environmental Science
Environmental Studies
Physical Science
Physics
Material Type:
Activity/Lab
Provider:
CLEAN: Climate Literacy and Energy Awareness Network
Provider Set:
CLEAN: Climate Literacy and Energy Awareness Network
Author:
CLEAN Community Collection
Sara Harris
University of British Columbia
Date Added:
03/09/2023
Air Masses
Read the Fine Print
Educational Use
Rating
0.0 stars

This is Activity 12 of a set of Level 1 activities designed by the Science Center for Teaching, Outreach, and Research on Meteorology (STORM) Project. The authors suggest that previous activities in the unit be completed before Activity 12: Air Masses, including those that address pressure systems and dew point temperature. In Activity 12, the students learn about the four main types of air masses that affect weather in the United States, their characteristic temperatures, and humidity levels as it relates to dew point temperatures. The lesson plan follows the 5E format. Initially, students discuss local weather and then examine surface temperature and dew point data on maps to determine patterns and possible locations of air masses. They learn about the source regions of air masses and compare their maps to a forecast weather map with fronts and pressure systems drawn in. During the Extension phase, students access current maps with surface and dew point temperatures at http://www.uni.edu/storm/activities/level1 and try to identify locations of air masses. They sketch in fronts and compare their results to the fronts map. Evaluation consists of collection of student papers.

Subject:
Atmospheric Science
Earth and Space Science
Material Type:
Activity/Lab
Provider:
National Science Teachers Association (NSTA)
Provider Set:
NGSS@NSTA
Date Added:
10/20/2023
Air Particulate Analysis
Conditional Remix & Share Permitted
CC BY-NC-SA
Rating
0.0 stars

Phase 1: Definition of Projects and Research Teams (Homework +1 Class)

Each student is assigned the task of proposing a site to investigate within the city and the surrounding region. Students are encouraged to discuss the assignment with community members for suggestions and inspiration. Each student will produce an easel-size poster of their proposal highlighting the following:


Site location;

Reasons for selecting this site;

Potential interest to the community;

Potential logistical problems associated with the proposed site/project.

Posters will be hung in a gallery-walk format, and each student will mark the location of their proposed study site on the classroom map of New York City. The class is given time to read and comment on each of their peers' proposals, after which the instructor will lead a class discussion of the interests, merits, and obstacles associated with each proposal, with the goal of having the class settle on the set of projects on which to move forward.
Students will define groups of 2 to 4 students per project. If more than 4 students are interested in the same site, then multiple groups may develop parallel projects.

Phase 2: Data Collection and Analysis (5 weeks)

In consultation with the instructor, teams develop and implement a sampling protocol, including the documentation of terrain, human activity, and weather conditions (wind speed and direction) at the time of collection. Sample stations and prevailing wind direction are plotted on Google Earth to determine likely sources of particulates. Using binocular microscopes students document size distribution, form, color, and abundance of particulates. This data is analyzed using statistical functions in Excel. Teams use SEM-EDS analysis to determine the composition of particles, and more fully describe their form. Teams submit weekly progress reports, including personal work reports for each team member.

Phase 3: Communication of Results (1 Week)

Teams submit to their instructor a formal laboratory report: Purpose, Equipment, Method, Data Tabulation, Data Analysis, and Conclusions.
Teams prepare an oral presentation, or visual information campaign, targeted at an audience of their choice (e.g., neighbors, church group, community activist group, college administration) using discourse appropriate to that audience. Teams present in an in-class dress-rehearsal prior to their formal presentation. Teams invite members of their desired audience to the presentation (official invitations sent). On the last day of class, the instructor leads a debriefing and critique of the presentations, highlighting results and effective communication techniques.

(Note: this resource was added to OER Commons as part of a batch upload of over 2,200 records. If you notice an issue with the quality of the metadata, please let us know by using the 'report' button and we will flag it for consideration.)

Subject:
Atmospheric Science
Biology
Earth and Space Science
Life Science
Material Type:
Activity/Lab
Provider:
Science Education Resource Center (SERC) at Carleton College
Provider Set:
Teach the Earth
Date Added:
12/10/2020
Air Pollution in the Pacific Northwest
Read the Fine Print
Educational Use
Rating
0.0 stars

Students are introduced to measuring and identifying sources of air pollution, as well as how environmental engineers try to control and limit the amount of air pollution. In Part 1, students are introduced to nitrogen dioxide as an air pollutant and how it is quantified. Major sources are identified, using EPA bar graphs. Students identify major cities and determine their latitudes and longitudes. They estimate NO2 values from color maps showing monthly NO2 averages from two sources: a NASA satellite and the WSU forecast model AIRPACT. In Part 2, students continue to estimate NO2 values from color maps and use Excel to calculate differences and ratios to determine the model's performance. They gain experience working with very large numbers written in scientific notation, as well as spreadsheet application capabilities.

Subject:
Applied Science
Atmospheric Science
Earth and Space Science
Engineering
Material Type:
Activity/Lab
Provider:
TeachEngineering
Provider Set:
TeachEngineering
Date Added:
09/18/2014
Air Quality: More than Meets the Eye
Conditional Remix & Share Permitted
CC BY-NC
Rating
0.0 stars

In this module, students engage in a visual demonstration on the causes & effects of air pollutants on air quality and kinesthetic activities on particulate matter & visibility.

Subject:
Atmospheric Science
Earth and Space Science
Material Type:
Lesson
Provider:
University of Colorado
Provider Set:
Cooperative Institute for Research in Environmental Sciences (CIRES)
Date Added:
03/09/2023
Air Under Pressure
Read the Fine Print
Educational Use
Rating
0.0 stars

Students are introduced to air masses, with an emphasis on the differences between and characteristics of high- versus low-pressure air systems. Students also hear about weather forecasting instrumentation and how engineers work to improve these instruments for atmospheric measurements on Earth and in space.

Subject:
Applied Science
Atmospheric Science
Earth and Space Science
Engineering
Material Type:
Activity/Lab
Lesson Plan
Provider:
TeachEngineering
Provider Set:
TeachEngineering
Date Added:
09/18/2014
Airplanes and Climate Change Educator Guide
Conditional Remix & Share Permitted
CC BY-NC-SA
Rating
0.0 stars

How much of an impact does air travel have on climate change? What can be done about it? Through a hands-on demonstration and a short literature review, students consider the impacts and future of aviation. With data, students consider why climate communicators and scientists focus on carbon dioxide. This guide is an extension of the TILclimate episode "TIL about planes."

Subject:
Atmospheric Science
Earth and Space Science
Material Type:
Lesson Plan
Provider:
MIT
Provider Set:
TILclimate Educator Hub
Date Added:
05/02/2023
America's Climate Choices: Advancing the Science of Climate Change
Read the Fine Print
Some Rights Reserved
Rating
0.0 stars

This video production is a part of a four-panel report from the National Academies' America's Climate Choices project. The video maps out the realm of our accumulated knowledge regarding climate change and charts a path forward, urging that research on climate change enter a new era focused on the needs of decision makers.

Subject:
Agriculture and Natural Resources
Applied Science
Atmospheric Science
Earth and Space Science
Environmental Science
Environmental Studies
Physical Science
Material Type:
Activity/Lab
Provider:
CLEAN: Climate Literacy and Energy Awareness Network
Provider Set:
CLEAN: Climate Literacy and Energy Awareness Network
Date Added:
03/09/2023
Analysis of Global Temperature Trends
Conditional Remix & Share Permitted
CC BY-NC-SA
Rating
0.0 stars

This lab activity is designed for science students in an introductory climatology course. Upon successful completion of the activity, students will have demonstrated an ability to:

Independently navigate and download climate data from online data libraries.
Work with different file types (NetCDF and CSV).
Write appropriate MATLAB code to read and manipulate climate data, and create plots (time series and maps) as instructed.
Extract meaningful information from large 3-dimensional datasets.
Understand and apply fundamental climatology concepts, such as:

Climate statistics (temporal and spatial mean and anomaly; trends; baselines)
Ice-albedo feedback resulting in disproportionate sensitivity to climate change in polar regions

(Note: this resource was added to OER Commons as part of a batch upload of over 2,200 records. If you notice an issue with the quality of the metadata, please let us know by using the 'report' button and we will flag it for consideration.)

Subject:
Atmospheric Science
Biology
Earth and Space Science
Life Science
Material Type:
Activity/Lab
Provider:
Science Education Resource Center (SERC) at Carleton College
Provider Set:
Teach the Earth
Date Added:
11/25/2019
Analyzing the Antarctic Ozone Hole (College Level)
Conditional Remix & Share Permitted
CC BY-NC-SA
Rating
0.0 stars

College-level adaptation of a chapter in the Earth Exploration Toolbook. Examine satellite images of atmospheric ozone in the Southern Hemisphere to study changes in concentration over a time.

(Note: this resource was added to OER Commons as part of a batch upload of over 2,200 records. If you notice an issue with the quality of the metadata, please let us know by using the 'report' button and we will flag it for consideration.)

Subject:
Atmospheric Science
Biology
Earth and Space Science
Life Science
Material Type:
Activity/Lab
Provider:
Science Education Resource Center (SERC) at Carleton College
Provider Set:
Teach the Earth
Date Added:
08/25/2020
Analyzing the data; "It's time to tell the story" about Buds, Leaves, and Global Warming
Read the Fine Print
Some Rights Reserved
Rating
0.0 stars

In this activity, students explore how the timing of color change and leaf drop of New England's deciduous trees is changing.

Subject:
Agriculture and Natural Resources
Atmospheric Science
Earth and Space Science
Ecology
Environmental Studies
Life Science
Physical Science
Material Type:
Activity/Lab
Provider:
CLEAN: Climate Literacy and Energy Awareness Network
Provider Set:
CLEAN: Climate Literacy and Energy Awareness Network
Date Added:
03/09/2023
Anchialine Pools STEM Kit
Conditional Remix & Share Permitted
CC BY-NC-SA
Rating
0.0 stars

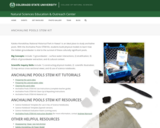
Anchialine Pools STEM Kit. This kit provides partner resources from the Kaloko-Honokōhau National Historical Park in Hawaii. The kit includes references to Native Hawaiian language and ecology with an Interview with Uncle Fred Cachola a local environmentalist. The Natural Sciences Education & Outreach Center collaborates with CSU faculty, National Parks and citizen science programs to translate their current scientific research into unique STEM experiences for students in the form of Educational Kits that can be checked out. Each kit contains just about all of the materials needed (minus common things like water and paper towels) to explore some really interesting scientific research topics.The kits are available for teachers and informal educators in Colorado to check out for a duration of a week by submitting either a local pickup form or a delivery form available at the linked website. This kit is provided free for educational use. This Kit is available in Spanish.

Subject:
Agriculture
Agriculture and Natural Resources
Anthropology
Applied Science
Arts and Humanities
Atmospheric Science
Biology
Business and Communication
Career and Technical Education
Chemistry
Comprehensive Health and Physical Education
Cultural Geography
Earth and Space Science
Ecology
Economics
English Language Arts
Environmental Science
Environmental Studies
Ethnic Studies
Geology
Geoscience
History
Hydrology
Languages
Life Science
Management
Maritime Science
Nutrition
Oceanography
Physical Geography
Physical Science
Physics
Political Science
Reading Informational Text
Religious Studies
Social Science
U.S. History
World Cultures
World History
Zoology
Material Type:
Activity/Lab
Case Study
Diagram/Illustration
Interactive
Lesson
Lesson Plan
Primary Source
Reading
Simulation
Student Guide
Unit of Study
Provider:
Colorado State University
Provider Set:
CSU Natural Sciences Education & Outreach Center
Date Added:
02/06/2023
Angle of Light Rays and Surface Distribution
Read the Fine Print
Educational Use
Rating
0.0 stars

This experimental activity is designed to develop basic understanding of the relationship between the angle of light rays and the area over which the light rays are distributed, and the potential to affect changes in the temperature of materials. Resources needed to conduct this activity include a flashlight, cardboard, protractor and ruler. The resource includes background information, a pre-activity inquiry exploration for students, teaching tips and questions to guide student discussion. This is chapter 4 of Meteorology: An Educator's Resource for Inquiry-Based Learning for Grades 5-9. The guide includes a discussion of learning science, the use of inquiry in the classroom, instructions for making simple weather instruments, and more than 20 weather investigations ranging from teacher-centered to guided and open inquiry investigations.

Subject:
Atmospheric Science
Earth and Space Science
Physical Science
Physics
Material Type:
Activity/Lab
Lesson Plan
Provider:
NASA
Provider Set:
NASA Wavelength
Date Added:
05/02/2023
Antarctic Life & Albedo
Conditional Remix & Share Permitted
CC BY-NC
Rating
0.0 stars

In this lesson, students explore the importance of albedo (or reflectivity) to penguins and the surfaces they inhabit and learn how penguin colonies may be mapped using satellites.

Subject:
Atmospheric Science
Earth and Space Science
Material Type:
Lesson
Provider:
University of Colorado
Provider Set:
Cooperative Institute for Research in Environmental Sciences (CIRES)
Date Added:
03/09/2023