Carbon calculators, no matter how well intended as tools to help measure …
Carbon calculators, no matter how well intended as tools to help measure energy footprints, tend to be black boxes and can produce wildly different results, depending on the calculations used to weigh various energy factors. By comparing different calculators, learners can analyze which ones are the most accurate and relevant, and which are the most transparent.
(Note: this resource was added to OER Commons as part of a batch upload of over 2,200 records. If you notice an issue with the quality of the metadata, please let us know by using the 'report' button and we will flag it for consideration.)
This activity applies to Teaching Principle 2: Climate is regulated by complex …
This activity applies to Teaching Principle 2: Climate is regulated by complex interactions among components of the Earth System. It specifically addresses Concept 2A: Earth's climate is influenced by interactions involving the sun, ocean, atmosphere, clouds, ice, land, and life. Climate varies by region as a result of local differences in these interactions. It is anticipated that the activity will take two 50 - 75 minute class periods with additional time for follow-up assessment. Students use web resources to identify climate patterns and distributions and synthesize the information to develop an understanding of the global variation.
Students develop tables of temperature and precipitation averages and also identify and describe an extreme weather event. This exercise is an inquiry-style lesson and can easily be adapted for use in or out of the classroom.
Note: Prior to this assignment, students should receive some information on how to sample climate data from the GLOBE or NASA sets, or how to find quality online resources about climate and climate variability. This could be done as a walk-through, in-class tutorial of government/ university research centers and SERC sites, comparing the information in each to less reliable sources such as Wikipedia.
(Note: this resource was added to OER Commons as part of a batch upload of over 2,200 records. If you notice an issue with the quality of the metadata, please let us know by using the 'report' button and we will flag it for consideration.)
This lesson unit is intended to help teachers assess how well students …
This lesson unit is intended to help teachers assess how well students are able to interpret exponential and linear functions and in particular to identify and help students who have the following difficulties: translating between descriptive, algebraic and tabular data, and graphical representation of the functions; recognizing how, and why, a quantity changes per unit intervale; and to achieve these goals students work on simple and compound interest problems.
Spreadsheets Across the Curriculum module/Geology of National Parks course. Students study how …
Spreadsheets Across the Curriculum module/Geology of National Parks course. Students study how discharge per unit area varies with elevation in the high country of Glacier National Park from USGS hydrograph data from Swiftcurrent Creek and its tributary Grinnell Creek..
(Note: this resource was added to OER Commons as part of a batch upload of over 2,200 records. If you notice an issue with the quality of the metadata, please let us know by using the 'report' button and we will flag it for consideration.)
Compasses and Codes. This is the Lesson 1 Exposure Activity, from Unit …
Compasses and Codes. This is the Lesson 1 Exposure Activity, from Unit 3 Natural Resources, from the DIGS (Developing Individuals, Growing Stewards) AmeriCorps Curriculum from CSU. The curriculum focuses on introducing students in grades 3-5 to Colorado agriculture, industry and environmental issues. The curriculum upon request. Visit: https://engagement.colostate.edu/programs-old/developing-individuals-growing-stewards/
In this exercise, students use whole-rock major- and trace-element compositions of volcanic …
In this exercise, students use whole-rock major- and trace-element compositions of volcanic rocks to explore the origins of compositional variation in igneous suites. Large datasets from the Yellowstone and Crater Lake calderas are downloaded from the GEOROC database, imported into Excel spreadsheets, and graphed to learn about the different petrogeneses of these two volcanic suites.
(Note: this resource was added to OER Commons as part of a batch upload of over 2,200 records. If you notice an issue with the quality of the metadata, please let us know by using the 'report' button and we will flag it for consideration.)
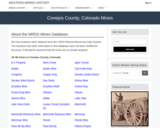
This Western Mining History database uses Mineral Resources Data System to list …
This Western Mining History database uses Mineral Resources Data System to list known Colorado historical mines by county. Each county site has links to the known mines within its borders. Some are known and named, others are unnamed. Mines should be assumed to be on private property unless other research is conducted. Data provided for each mine site include: Name, State, County, Elevation, Primary Mineral Mined, Latitude and Longitude and a link to Google Maps. Photos are provided where available. Additional information for some Mines are satellite photos, and ownership, business and historical records. Mining History is an historical site that provides information on mining, mining towns, the gold and silver rush, and Photos and maps of the western United States. This is a great database for student historical research or data and statistics classes. Consider becoming a member or making a donation to help further the work of the site.
This activity represents a culmination project for this unit by means of …
This activity represents a culmination project for this unit by means of which students can assess whether the IPCC prediction of increased storminess as an outcome of global warming survives testing. For the previous three weeks students will have conducted several inquiry-based group activities designed to introduce and reinforce fundamental meteorology/climatology concepts. In this 2-day project, students access online AVHRR SST imagery, as well as tabulated numeric data regarding historical North American tropical cyclones, import data into Excel for interpretation and analysis, and submit two group reports.
(Note: this resource was added to OER Commons as part of a batch upload of over 2,200 records. If you notice an issue with the quality of the metadata, please let us know by using the 'report' button and we will flag it for consideration.)
This laboratory activity takes place in a computer lab that is equipped …
This laboratory activity takes place in a computer lab that is equipped with ArcGIS (we are currently using ArcGIS 9.3). Students will go to NASA's oil spill gallery website and download the full size image of the Deepwater Horizon oil slick from July 14th, 2010 taken by the Moderate Resolution Imaging Spectroradiometer (MODIS) on NASA's Aqua satellite at 1:55 p.m. Central Daylight Time. Their task is to to analyze the satellite imagery as an RGB composite and to experiment with reclassification techniques to subdivide the continuous raster dataset into user-defined numbers of ranges that will help visualize the oil spill. The activity introduces students to GIS software, remote sensing analysis, and sets up questions on spatial patterns and consequences of energy use.
(Note: this resource was added to OER Commons as part of a batch upload of over 2,200 records. If you notice an issue with the quality of the metadata, please let us know by using the 'report' button and we will flag it for consideration.)
No restrictions on your remixing, redistributing, or making derivative works. Give credit to the author, as required.
Your remixing, redistributing, or making derivatives works comes with some restrictions, including how it is shared.
Your redistributing comes with some restrictions. Do not remix or make derivative works.
Most restrictive license type. Prohibits most uses, sharing, and any changes.
Copyrighted materials, available under Fair Use and the TEACH Act for US-based educators, or other custom arrangements. Go to the resource provider to see their individual restrictions.