To prepare for this exercise, students do background reading (from journal articles …
To prepare for this exercise, students do background reading (from journal articles selected by instructor) and participate in classroom lectures about various types of qualitative and quantitative paleoclimate data (including rock/sed. type, stable isotopes, and fluid inclusions). Then, they are given the assignment and asked to complete it on their own (or in groups of two). The assignment consists of four paleotemperature curves. One curve is from the Vostok ice core of Antarctica and another represents the GRIP ice core from Greeenland (Jouzel et al., 1987, 1993; Chapellaz et al., 1997). Two halite cores, one from Death Valley and one from Chile, are also represented (Lowenstein et al., 1998, 1999; Hein, 2000). Students answer written questions that ask them to identify coldest and warmest times in the past 150,000 years, that ask them if cores can be correlated, that ask them if they can distinguish local, regional, and global warming and cooling trends. They are also asked how to better resolve paleoclimate data from this time period. The final questions ask students how confident they would feel about using this data to make paleoclimate predictions into the future. After the students have completed in turned in their assignment, we have a class discussion about the exercise, using the questions to guide us. This discussion can be supplemented with predictions from climate models and explanations of different types of paleoclimate data.
(Note: this resource was added to OER Commons as part of a batch upload of over 2,200 records. If you notice an issue with the quality of the metadata, please let us know by using the 'report' button and we will flag it for consideration.)
This activity is for an introductory oceanography course. It is designed to …
This activity is for an introductory oceanography course. It is designed to allow students to use various tools (satellite images, Google Earth) to explore the shape of the sea floor and ocean basins in order to gain a better understanding of both the processes that form ocean basins, as well as how the shape of ocean basins influences physical and biological processes.
(Note: this resource was added to OER Commons as part of a batch upload of over 2,200 records. If you notice an issue with the quality of the metadata, please let us know by using the 'report' button and we will flag it for consideration.)
Students use detailed bathymetric maps to find submarine landslides and compare the …
Students use detailed bathymetric maps to find submarine landslides and compare the slope of these slides to the slope of hills near school and home. By comparing the slopes they can consider slope failure, especially during earthquakes.
This exercise shows how well logs are used in the petroleum industry. …
This exercise shows how well logs are used in the petroleum industry. It is designed as a first exposure to well logs for undergraduate geology majors and introduces not only well logs and their interpretation as proxies for stratigraphic sections, but also investigates concepts of porosity and permeability, oil reservoirs, and structural traps.
In this role-playing activity, students are assigned into groups which will explore …
In this role-playing activity, students are assigned into groups which will explore specific roles related to Hurricane Sandy. A mock town meeting scenario where the community is requesting input for how to address the challenges of rebuilding their homes, businesses, and infrastructure allows for the class to learn more about the multiple perspectives, issues, and interests resulting from this devastating disaster.
(Note: this resource was added to OER Commons as part of a batch upload of over 2,200 records. If you notice an issue with the quality of the metadata, please let us know by using the 'report' button and we will flag it for consideration.)
This activity asks students who are soon to enter an introductory geology …
This activity asks students who are soon to enter an introductory geology course at the college level to collect a local rock from their home, vacation locale, or elsewhere prior to the course start date and do a ROCKD local query (or MacroStrat search) on the bedrock unit description. Both the rock and the description from the mobile and web applications will be re-visited throughout the semester's course. Formal components of the activity will be an initial observation and writing assignment at the course's start, and then a more extensive writing and ROCKD and MacroStrat research assignment at the course's end.
Activity outcomes include: Fluency in general rock descriptive terminology Ability to read and use geologic maps Ability to interpret geological sample details toward understanding earth history Ability to identify geological sample details toward understanding economic value of rock types Ability to identify geological sample details toward understanding surface landscape characteristics and local environmental issues
In this lab, students learn to use the matlab seawater toolbox and …
In this lab, students learn to use the matlab seawater toolbox and use this tool to test a number of things that I have asserted to them in class with regard to the contribution of temperature and potential temperature to density variability in the ocean.
In this lab exercise, students investigate taphonomic processes operating on a large …
In this lab exercise, students investigate taphonomic processes operating on a large vertebrate carcass (whitetail deer: Odocoileus virginianus) in a temperate, humid, terrestrial environment (i.e., central Ohio). Prior to the lab, students read the 1991 review article on terrestrial vertebrate accumulations by A. K. Behrensmeyer. Once in the field, they familiarize themselves with the locality and note the state of the carcass and the position of any disarticulated portions of the beast. Using the stake flags they mark the location of all the elements of the carcass. Next, using the Brunton compasses and the measuring tape, create a map of the site. They then reassemble all the elements of the carcass on the tarp and identify all of the skeletal elements. Finally, the students compare the disarticulated skeleton with a control carcass placed in a wire mesh cage designed to exclude any macro-scavengers. In the lab, student synthesize their results and respond to a series of questions related to vertebrate taphonomy and the quality of the fossil record.
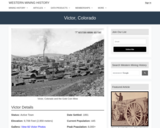
Victor, CO Mining Town. Western Mining History presents a brief summary of …
Victor, CO Mining Town. Western Mining History presents a brief summary of Colorado's Historical Mining Towns with links to additional Colorado resources for a mining town database and mines by county. Western Mining History is an historical site that provides information on mining, mining towns, the gold and silver rush, and Photos and maps of the western United States. This is a strong primary source resource that can be used for a variety of class research projects. Consider becoming a member or making a donation to help further the work of the site.
In Exercise 1, students are given modified data published by Cole & …
In Exercise 1, students are given modified data published by Cole & Friberg, 1989, Stratigraphy and Sedimentation of the Book Cliffs, Utah. They follow instructions to construct a measured section. In Exercise 2, students work either with polarized microscopic photographs linked online to specific units in their measured section or directly with the thin-sections. Grain characteristics are measured and observed. In Exercise 3, facies units are determined on the basis of bedding, sedimentary structures, trace and macrofossil evidence. An interpreted facies overlay of their first graphically generated measured section. A table is also generated to support their facies determinations. In Exercise 4, correlations are made using an east-west transect of several stratigraphic sections. Shallowing-upward cycles and exposure and flooding surfaces are marked; lateral facies correlations are made.
(Note: this resource was added to OER Commons as part of a batch upload of over 2,200 records. If you notice an issue with the quality of the metadata, please let us know by using the 'report' button and we will flag it for consideration.)
This project is designed to get students thinking about some of the …
This project is designed to get students thinking about some of the basic properties of sedimentary rocks that can be used to interpret their environment of deposition. In particular, it focues on characterizing lithology (rock type), bedding style, and grain size for rock units from the Pennsylvanian age Jackfork Group.
(Note: this resource was added to OER Commons as part of a batch upload of over 2,200 records. If you notice an issue with the quality of the metadata, please let us know by using the 'report' button and we will flag it for consideration.)
The concept of water activity is important to food preservation. When water …
The concept of water activity is important to food preservation. When water activity is less than 0.6, almost all microbes, including bacteria, molds, and yeasts, stop growing. Vegetables are usually dried even further, to water activity of 0.3 or 0.2, for quality and storage. Virtual Labs – Controlling Water Activity in Food explores a traditional method of preserving corn by drying. In this virtual laboratory, learners test water activity levels of dried corn and explore how they change under three different storage environments. The interactive animation guides users through the theory and practice of sampling a food product, using a water activity meter, and setting up replicates, to build familiarity with concepts and procedures used in real food science labs. Before beginning this lab, it may be useful to complete Virtual Labs – Understanding Water Activity.
A virtual landscape is a virtual reality environment designed to develop geologic …
A virtual landscape is a virtual reality environment designed to develop geologic mapping and field skills. They include natural landscapes where the geology can be mapped, and interactive 3D block models of topographic and geological maps. The worlds can be found at www.see.leeds.ac.uk/virtual-landscapes/.
A primary objective of marine science classes is to learn the location …
A primary objective of marine science classes is to learn the location and formation of ocean sediment types. Nearly 50 years of scientific ocean drilling has produced a tremendous scientific collection of cores from the global ocean floor. In addition, there are large online databases and related publications that have a wealth of associated information to supplement physical cores. Here we created a virtual marine core collection that provides exemplars of the primary ocean sediment lithologies, along with links to expedition reports and datasets, and tips for making requests for real core samples to use in education.
(Note: this resource was added to OER Commons as part of a batch upload of over 2,200 records. If you notice an issue with the quality of the metadata, please let us know by using the 'report' button and we will flag it for consideration.)
After watching a video, students classify soils using a ternary soil diagram …
After watching a video, students classify soils using a ternary soil diagram and run online computer models to see how the proportion of sand, silt and clay affect drainage. Students then use the ternary soil diagram to predict how real soils (found from online soil maps) will behave in terms of runoff and infiltration.
This activity introduces students to visualization capabilities available through NASA's Earth Observatory, …
This activity introduces students to visualization capabilities available through NASA's Earth Observatory, global map collection, NASA NEO and ImageJ. Using these tools, students build several animations of satellite data that illustrate carbon pathways through the Earth system.
This is a take-home exercise for junior or senior-level students in a …
This is a take-home exercise for junior or senior-level students in a Sedimentation/Stratigraphy course. It may be used to bridge topics of geomorphology, depositional environments and clastic sedimentology. The exercise focuses on visualizing journal article data in a meaningful way. In addition to defining technical terms, students are asked to use background knowledge of Walther's Law to complete a series of vertical sections. Approximate time to complete the exercise is 4-5 hours. Individual assignment (as opposed to group work) is recommended.
(Note: this resource was added to OER Commons as part of a batch upload of over 2,200 records. If you notice an issue with the quality of the metadata, please let us know by using the 'report' button and we will flag it for consideration.)
This screenshot shows the Fiji subduction zone, one of the featured convergent …
This screenshot shows the Fiji subduction zone, one of the featured convergent margins in this visualization. The visualization shows how earthquakes at this margin occur at depth, and define the slope of the subducting plate. This visualization also includes other examples of subduction zones and continental convergent margins (Himalayas). Click the image to enlarge or view the MP4 movie (MP4 Video 30.3MB Dec20 11). The purpose of this activity is to introduce students to the distribution and characteristics of earthquakes associated with convergent plate boundaries. Students will learn about how the magnitude and distribution of earthquakes at convergent boundaries are related to processes that occur at these boundaries and to the geometry and position of the two converging plates. Because the depth of earthquakes can be difficult for students to visualize in 2D representations, this activity allows students to visualize the 3D distribution of earthquakes within Earth's surface, which is essential for understanding how different types of earthquakes occur in different tectonic settings. Locations featured in the visualization include the Chile-Peru Subduction Zone, the Aleutian Islands, the Fiji Subeuction Zone, and the Himalayas. Talking points and questions are included to use this visualization as part of an interactive lecture. In addition to playing back the visualization, instructors can also download the visualization software and data set and explore it themselves.
(Note: this resource was added to OER Commons as part of a batch upload of over 2,200 records. If you notice an issue with the quality of the metadata, please let us know by using the 'report' button and we will flag it for consideration.)
This learning module demonstrates how topographic maps depict elevation differences and the …
This learning module demonstrates how topographic maps depict elevation differences and the shape of a landscape by utilizing 3-D visualizations. 2-D topographic maps are paired with 3-D visualizations of these maps, complete with interactive capabilities that allow the learner to rotate or tilt the visualization in order to gain different perspectives. Other animated features include sequential vertical slicing of a topographic cube and flooding of 3-D rendered surfaces. The goal is for the student to be able to read this type of map and easily recognize the surface features the map represents. This module is a series of visualizations set within a lesson activity that leads the student on an exploration of how 2-D topographic maps depict the 3-D character of a landscape surface. The learner embarks on a guided tour of 3-D landscapes, yet sets the pace of the adventure and is free to move backward and forward on the journey. Features explained and depicted include contour lines, cliffs, hills, valleys, and profiles. This visualization is part of a curriculum developed by Steve Reynolds, geology professor at Arizona State University. His website contains a variety of 3-D perspectives, color photographs, and information regarding the Geology of Arizona, Landscapes of the Southwest, structural geology, and science-education reform.
(Note: this resource was added to OER Commons as part of a batch upload of over 2,200 records. If you notice an issue with the quality of the metadata, please let us know by using the 'report' button and we will flag it for consideration.)
In this lab activity, students are given a data set that has …
In this lab activity, students are given a data set that has been developed on sea level rise and storm surge for a coastal community in Maine. Students will gain experience in how to use cartography to select important variables that they want to communicate to local officials. The challenge is to distill a rich, local data set into an understandable visualization and how to effectively use cartographic principles to convey this information. This will provide experience on cartography early on in the class that will be applied later to their own data sets. It will also enable them to understand the complexity of natural and social impacts of sea level rise and in combination of storm surge
(Note: this resource was added to OER Commons as part of a batch upload of over 2,200 records. If you notice an issue with the quality of the metadata, please let us know by using the 'report' button and we will flag it for consideration.)
No restrictions on your remixing, redistributing, or making derivative works. Give credit to the author, as required.
Your remixing, redistributing, or making derivatives works comes with some restrictions, including how it is shared.
Your redistributing comes with some restrictions. Do not remix or make derivative works.
Most restrictive license type. Prohibits most uses, sharing, and any changes.
Copyrighted materials, available under Fair Use and the TEACH Act for US-based educators, or other custom arrangements. Go to the resource provider to see their individual restrictions.