This is an activity that uses the spreadsheet program Excel to explore …
This is an activity that uses the spreadsheet program Excel to explore the origins of subsidence in New Orleans. There are two versions. The first is a traditional Spreadsheets Across the Curriculum (SSAC) module that couples a PowerPoint presentation with an embedded Excel spreadsheet where students construct a spreadsheet, and then submit the Excel file for grading. The second is a macro-enabled Excel spreadsheet that provides automatic feedback to answers and calculates the score. Upon completion the students are given a code that encrypts their spreadsheet score and then take a follow-up quiz that probes their understanding.
(Note: this resource was added to OER Commons as part of a batch upload of over 2,200 records. If you notice an issue with the quality of the metadata, please let us know by using the 'report' button and we will flag it for consideration.)
Landscape evolution provides a convenient framework for understanding geologic time and rates …
Landscape evolution provides a convenient framework for understanding geologic time and rates because students can observe how processes like erosion and deposition shape their surroundings, even in urban settings. In order to describe landscapes qualitatively and quantitatively, students build 3-D sandbox models based on topographic maps and design and stage a "virtual adventure race." Sandbox landscapes are used to illustrate erosional processes, the role of water in sediment transport, relief change, and how erosion exhumes rocks from depth, while local examples are used to discuss landscapes as transient or steady over different time- and length scales. To convince students that the observed processes act over millions of years to shape Earth's surface, quantitative dating tools are introduced. Dice experiments illustrate radioactive decay and the shape of the age equation curve, and 14C dating, geochronology and thermochronology are introduced as "stopwatches" that start when a plant dies, a crystal forms, or a rock nears the surface and cools to a certain temperature. The sandbox model and thermochronometer "stopwatches" are combined to measure erosion rates at a point, uniform and spatially variable erosion, and rates of landscape change. Ultimately, model rates (cm/hour) calculated from stopwatch times on the order of seconds can be related to geologic rates (km/My) calculated from real million-year-old samples. SEE POSTER for detailed descriptions of each activity in Parts 1-4 (complete with specific Learning Goals, Context, Materials, Activity Summary, Evaluation, and adaptation to challenge students in grades 9-16).
(Note: this resource was added to OER Commons as part of a batch upload of over 2,200 records. If you notice an issue with the quality of the metadata, please let us know by using the 'report' button and we will flag it for consideration.)
In order to promote students’ conceptual understanding and learning experience in introductory …
In order to promote students’ conceptual understanding and learning experience in introductory statistics, a technology task, which focuses on the probability distribution in which means are defined, was created using TinkerPlots, an exploratory data analysis and modeling software. The targeted audiences range from senior high school grade levels to college freshmen who are starting their introductory course in statistics. Students will be guided to explore and discover the movement behaviors of means of a set of numbers randomly generated from a fixed range of values characterized by a predetermined probability distribution. The cognitive, mathematical, technological and pedagogical natures of the task, as well as its association with the statistics education framework based on the Guidelines for Assessment and Instruction in Statistics Education (GAISE) by the American Statistical Association, will be elaborated. A brief discussion on what cognitive design principles this task satisfies will also be provided at the end.
Students use STELLA to create a model of heatflow in permafrost to …
Students use STELLA to create a model of heatflow in permafrost to attempt to replicate the findings of Lachenbruch and Marshall (1986), who used inflections in the geothermal gradient of Alaskan permafrost to search for evidence of climatic change.
(Note: this resource was added to OER Commons as part of a batch upload of over 2,200 records. If you notice an issue with the quality of the metadata, please let us know by using the 'report' button and we will flag it for consideration.)
Students will have been exposed to the concept of theoretical morphospace in …
Students will have been exposed to the concept of theoretical morphospace in class prior to undertaking the lab. When introducing the lab exercise, the basic algorithm for stochastic growth is presented and students are walked through how to run the program (it is interactive). After they have completed all the exercises, they are asked to use their virtual stromatoporoid sponges as the basis for interpreting a set of real specimens.
(Note: this resource was added to OER Commons as part of a batch upload of over 2,200 records. If you notice an issue with the quality of the metadata, please let us know by using the 'report' button and we will flag it for consideration.)
This homework assignment gives students first-hand experience with thermobarometric calculations. Because many …
This homework assignment gives students first-hand experience with thermobarometric calculations. Because many of my students are math challenged, I give them a choice of solving the equations by hand or with Excel. They must first look at mineral compositions and make predictions regarding relative pressures, then calculate conditions for two sets of compositions, and finally use the P-T results to evaluate a tectonic hypothesis. The "thinking" questions are very open ended and can involve discussion of diffusion, heat flow, and tectonic settings.
(Note: this resource was added to OER Commons as part of a batch upload of over 2,200 records. If you notice an issue with the quality of the metadata, please let us know by using the 'report' button and we will flag it for consideration.)
Think Stats is an introduction to Probability and Statistics for Python programmers. …
Think Stats is an introduction to Probability and Statistics for Python programmers.
*Think Stats emphasizes simple techniques you can use to explore real data sets and answer interesting questions. The book presents a case study using data from the National Institutes of Health. Readers are encouraged to work on a project with real datasets. *If you have basic skills in Python, you can use them to learn concepts in probability and statistics. Think Stats is based on a Python library for probability distributions (PMFs and CDFs). Many of the exercises use short programs to run experiments and help readers develop understanding.
Students are introduced to the use of linear algebra in an intuitive …
Students are introduced to the use of linear algebra in an intuitive and accessible way, through classroom activity and homework set. The familiar three-point problem is cast in terms of three dimensional analytic geometry, fostering understanding of mathematical models for simple geometric forms.
(Note: this resource was added to OER Commons as part of a batch upload of over 2,200 records. If you notice an issue with the quality of the metadata, please let us know by using the 'report' button and we will flag it for consideration.)
In this lab activity the students will learn basic statistical and graph …
In this lab activity the students will learn basic statistical and graph skills by analyzing real world climate data sets.
(Note: this resource was added to OER Commons as part of a batch upload of over 2,200 records. If you notice an issue with the quality of the metadata, please let us know by using the 'report' button and we will flag it for consideration.)
This activity teaches students about the setting of Harper Lee’s famous novel …
This activity teaches students about the setting of Harper Lee’s famous novel “To Kill a Mockingbird,” which takes place during 3 years (1933–1935) of the Great Depression. Part 1 of this activity can be used before students start reading the novel to help them understand what life was like in the 1930s. In this part, students will examine and answer questions about census documents that feature unemployment numbers and related information. Part 2 can be completed after students have read the first few chapters of the novel. In this part, students will write a piece using the RAFT technique (role, audience, format, topic) to show what they learned about the 1930s and what they have read so far.
An in class demonstration of the vastness of geologic time using a …
An in class demonstration of the vastness of geologic time using a 1000-roll sheet of toilet paper and unrolling it around the room.
(Note: this resource was added to OER Commons as part of a batch upload of over 2,200 records. If you notice an issue with the quality of the metadata, please let us know by using the 'report' button and we will flag it for consideration.)
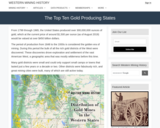
Western Mining History presents a comparison of the output of the top …
Western Mining History presents a comparison of the output of the top 10 Gold Producing States. Colorado is number 2 as of 1965. Western Mining History is an historical site that provides databases, information on mining, mining towns, gold and Photos and maps of the western United States. Consider becoming a member or making a donation to help further the work of the site.
This is a teaching module presenting an introduction to modeling ground water …
This is a teaching module presenting an introduction to modeling ground water pollution, directed to undergraduate students in applied mathematics. It begins with a brief discussion of Darcy's law concerning the flow of a fluid through a porous medium. A mathematical model that uses field data to track ground-water contamination is presented. Students working with the module will write a MATLAB script to obtain a numerical solution of the model and apply it to investigate a real event of groundwater pollution.
Students come to this activity familiar with the basic assumptions of plate …
Students come to this activity familiar with the basic assumptions of plate tectonics. Using a Google Earth platform showing commonly accepted lithospheric plate boundaries as well as locations of GPS stations, students form a hypothesis about motions expected across a particular boundary. They then set about testing their hypotheses by plotting motion vectors using two independent methods.
METHOD 1: LONG-TERM "MODEL" RATES OF PLATE MOTION Students use a "Plate Motion Calculator" to determine "model" rates of plate motion averaged over millions of years.
METHOD 2: GPS MEASUREMENTS INTERPRETED IN TERMS OF PLATE MOTION Students interpret GPS data as near real-time rates of plate motion. RESULTS Students find that in general, plate tectonic theory holds up. However, they also discover sophisticated detail -- rates are not constant, internal deformation of plates does occur and some boundaries are "wider" than others. Student evaluations of the activity demonstrate that they feel engaged and empowered as they work with authentic data, and gain a sophisticated understanding of a fundamental theory as well as the process of doing science.
(Note: this resource was added to OER Commons as part of a batch upload of over 2,200 records. If you notice an issue with the quality of the metadata, please let us know by using the 'report' button and we will flag it for consideration.)
This is an activity about transport of sediment contaminated by copper, arsenic, …
This is an activity about transport of sediment contaminated by copper, arsenic, and other heavy metals that was deposited into the Clark Fork River channel as the result of historical mining activity. The Clark Fork River between Butte and Milltown, Montana has been the focus of several large superfund projects designed to address the impacts of this legacy of mining in the watershed. This activity is used in an introductory physical geology lab (primarily non-majors) with students who may have limited experience working with quantitative analysis and analyzing graphs.
(Note: this resource was added to OER Commons as part of a batch upload of over 2,200 records. If you notice an issue with the quality of the metadata, please let us know by using the 'report' button and we will flag it for consideration.)
In this dynamic data science activity, students use data to build binary …
In this dynamic data science activity, students use data to build binary trees for decision-making and prediction. Prediction trees are the first steps towards linear regression, which plays an important role in machine learning for future data scientists. Students begin by manually putting “training data” through an algorithm. They can then automate the process to test their ability to predict which alien creatures are sick and which are healthy. Students can “level up” to try more difficult scenarios.
Students learn about tsunami vertical evacuation structures (TVES) as a viable solution …
Students learn about tsunami vertical evacuation structures (TVES) as a viable solution for communities with high ground too far away for rapid evacuation. Students then apply basic design principles for TVES and make their own scale model that they think would fit will in their target community. Activity has great scope for both technical and creative design as well as practical application of math skills. Examples are from the Pacific Northwest, USA's most tsunami-vulnerable communities away from high ground, but it could be adapted to any region with similar vulnerability.
(Note: this resource was added to OER Commons as part of a batch upload of over 2,200 records. If you notice an issue with the quality of the metadata, please let us know by using the 'report' button and we will flag it for consideration.)
No restrictions on your remixing, redistributing, or making derivative works. Give credit to the author, as required.
Your remixing, redistributing, or making derivatives works comes with some restrictions, including how it is shared.
Your redistributing comes with some restrictions. Do not remix or make derivative works.
Most restrictive license type. Prohibits most uses, sharing, and any changes.
Copyrighted materials, available under Fair Use and the TEACH Act for US-based educators, or other custom arrangements. Go to the resource provider to see their individual restrictions.